Project Osmos is most useful when the desired outcome is clear but the path from source tables to a trustworthy analytical model still requires engineering judgement. In this walkthrough, Osmos transformed synthetic AdventureWorksLT-style sales data in SalesLake into a new Gold model in SalesAnalyticsOsmos, without changing the source.
This is not a toy diagram. The task produced persisted Delta tables, a published notebook, validation evidence, and a reconciliation result that exposed an inconsistency in the source data.
The value chain
SalesLake (read-only source)
        |
        v
Project Osmos: profile, model, stage, promote
        |
        v
SalesAnalyticsOsmos / SalesOsmos
        |
        v
Gold star schema + validation notebook
        |
        v
Power BI, Fabric IQ, agents, and downstream analytics
The destination workspace is intentionally named SalesAnalyticsOsmos, and the lakehouse is SalesOsmos. The data is synthetic, so the names, row counts, table names, and example values are safe to show.
1. Start from a read-only source
The source lakehouse contains AdventureWorksLT-style tables for customers, products, categories, addresses, orders, and order lines. The source is treated as an immutable boundary: Osmos reads it, but the transformation writes only to the destination.
The destination was created as a separate lakehouse so that the source remains a reliable comparison point.
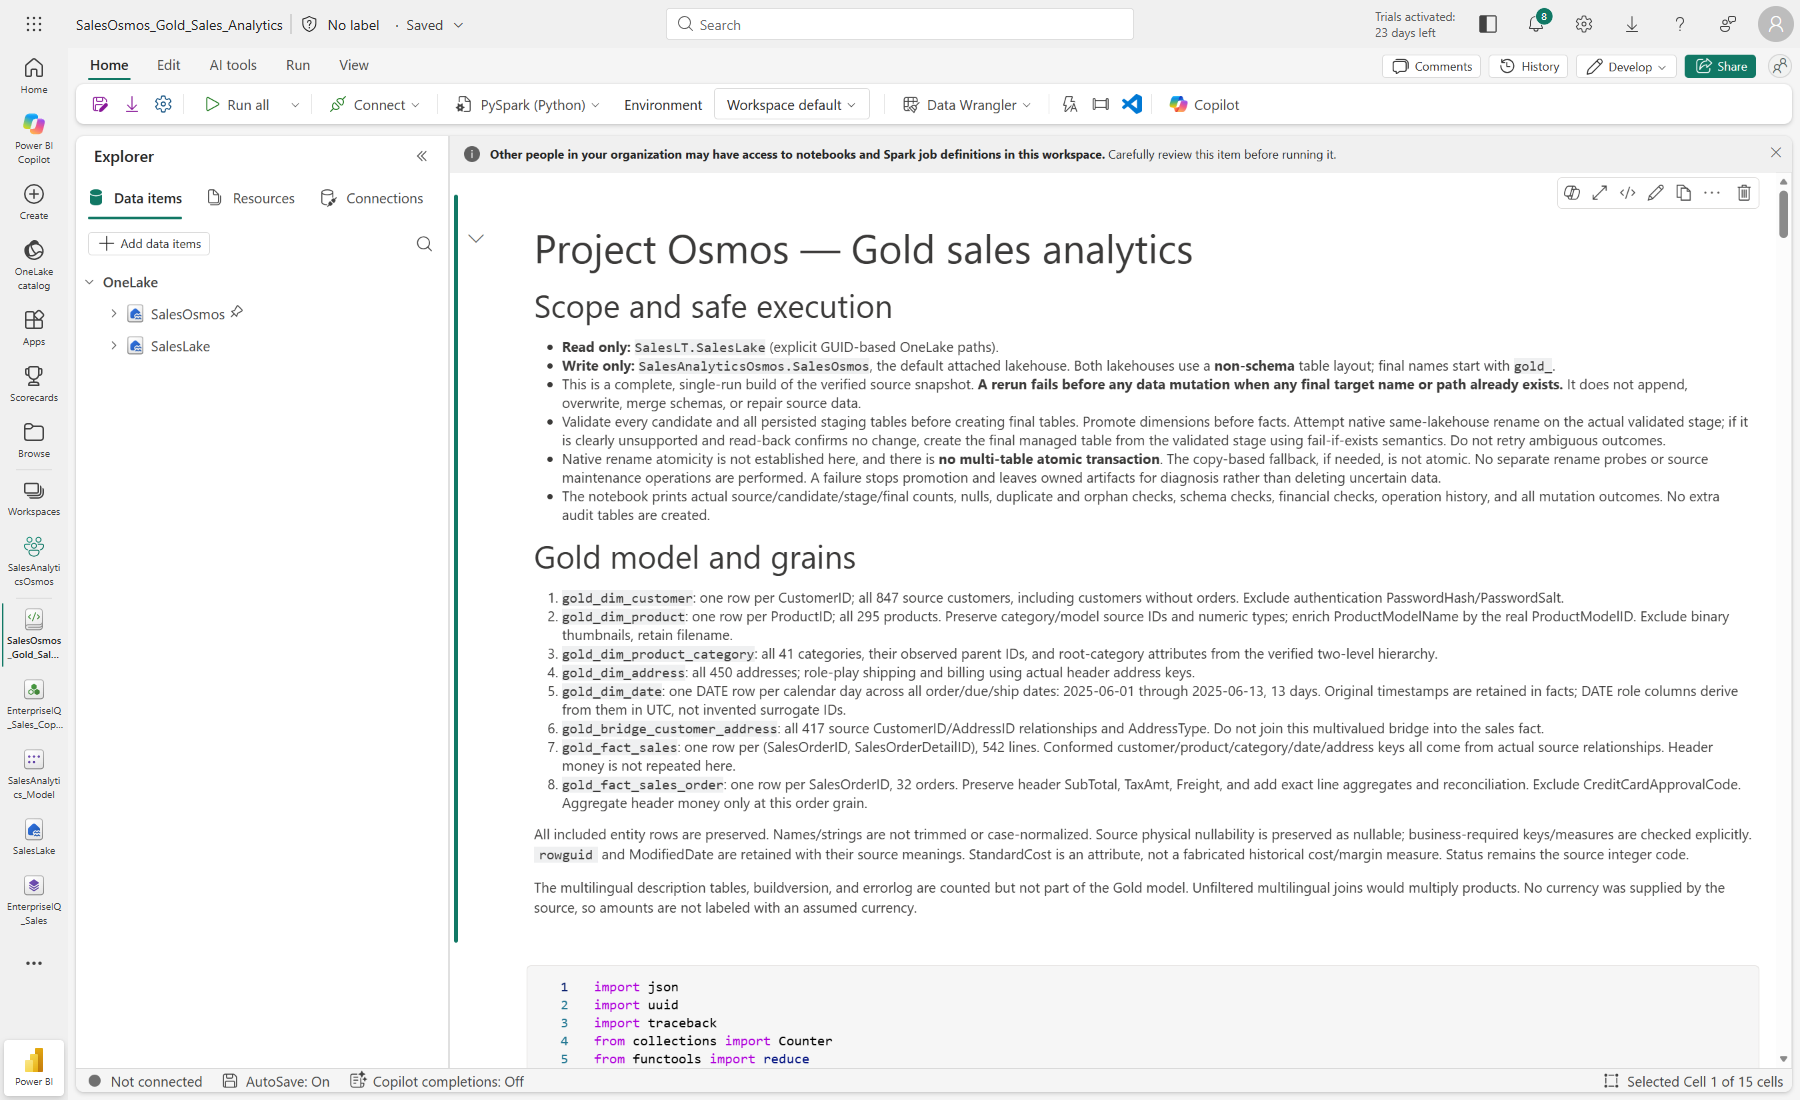
The completed notebook is published in the Project Osmos folder of the destination workspace.
2. Let Osmos build a usable Gold shape
The resulting model separates dimensions, a bridge, and two fact grains:
| Area | Tables |
|---|---|
| Dimensions | gold_dim_customer, gold_dim_product, gold_dim_product_category, gold_dim_address, gold_dim_date |
| Bridge | gold_bridge_customer_address |
| Facts | gold_fact_sales, gold_fact_sales_order |
That distinction matters. Line-level sales and order-level header totals are different grains. Combining them into one table would make header subtotals easy to double-count.
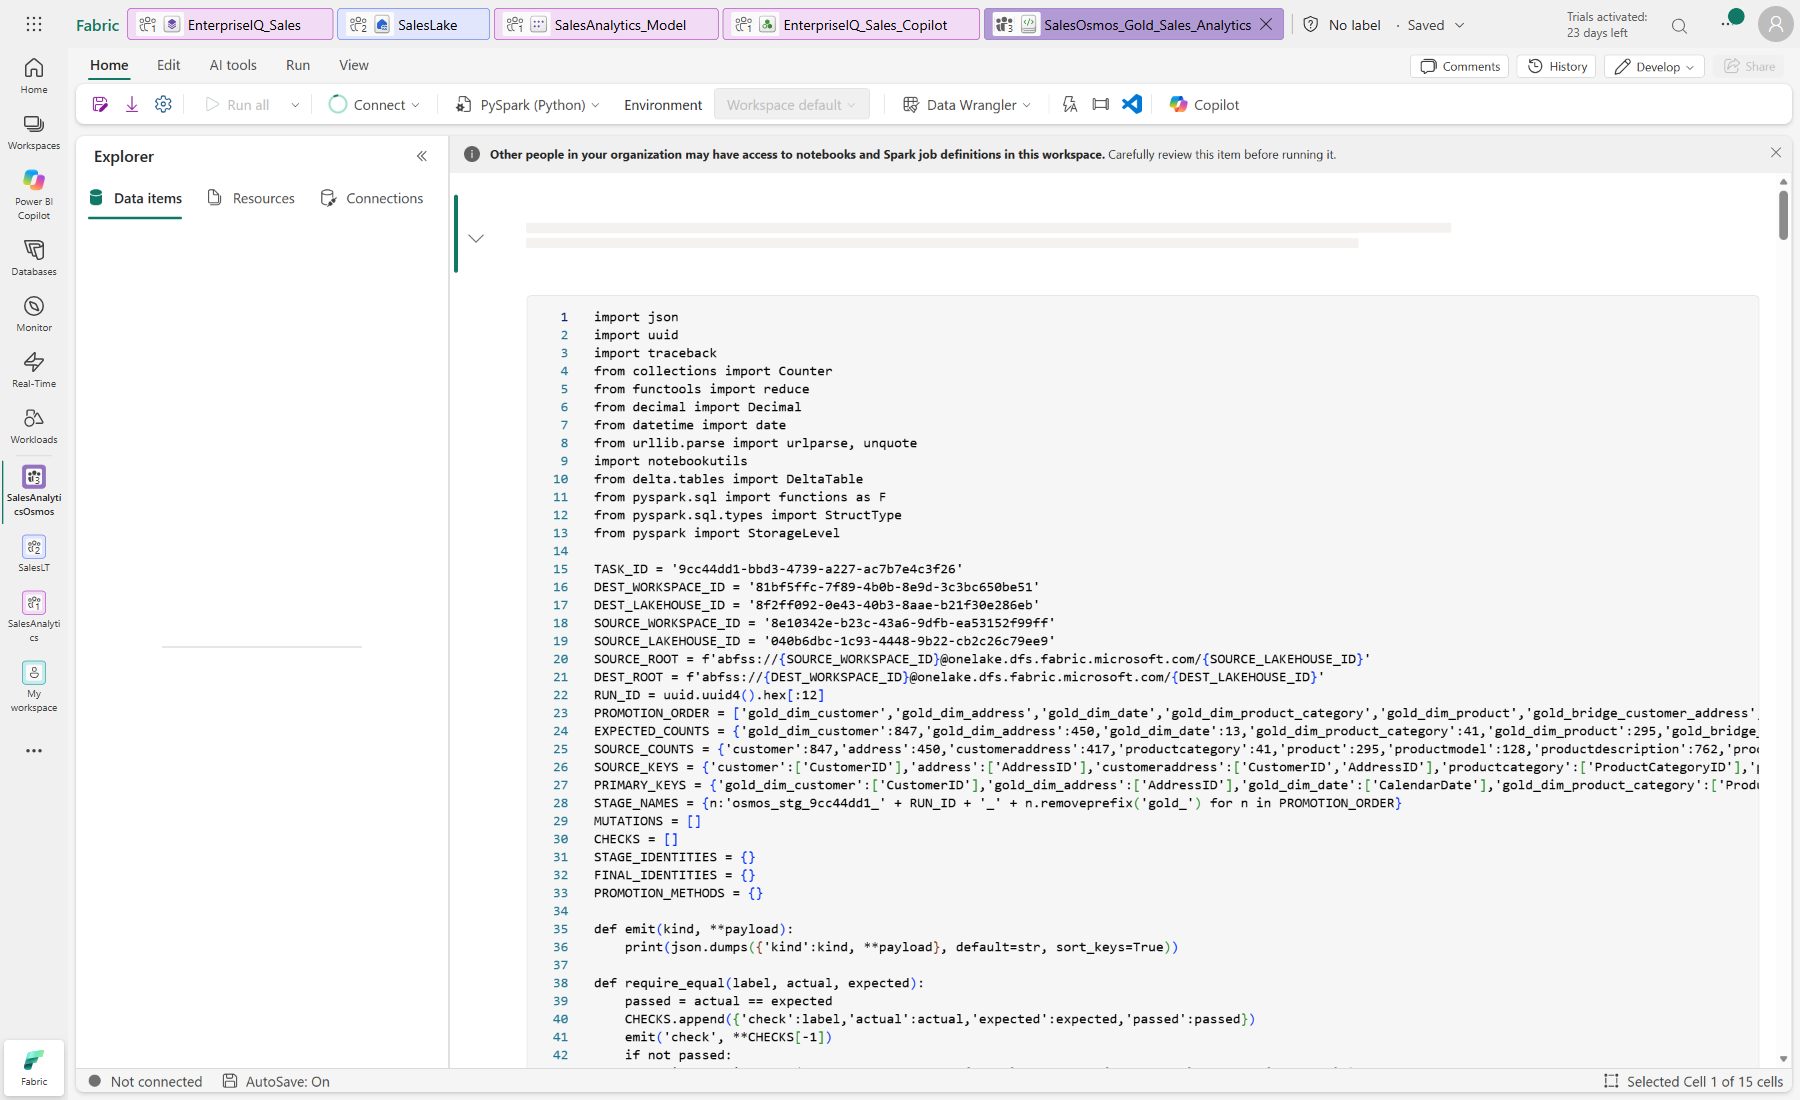
The notebook is more than a code dump. It records the model contract, the validation outputs, and the reconciliation logic so another engineer can inspect or rerun the result.
3. Validate before trusting the model
The completed run reported:
- 630 build checks passed;
- 0 duplicate primary keys;
- 0 required-key or measure nulls;
- 0 orphan rows across 21 relationships;
- 0 missing or unexpected retained source rows;
- 13 contiguous dates from June 1 through June 13, 2025;
- 2,637 rows written once;
- 8 staging creates and 8 native renames;
- no staging tables or paths left behind;
- source Delta tables remained at version 0.
This is the point where “the tables are visible” becomes “the model is evidenced.”
4. Reconciliation found a source-data issue
The Gold line fact calculates:
Gross line sales       714,002.9136
Line discounts           5,312.760542
Calculated line net    708,690.153058
The source order headers report a subtotal of 865,433.1171, a difference of 156,742.96404200. All 32 of 32 orders differ.
The difference is not caused by missing joins, duplicate rows, or rounding. The observed header pattern is consistent with category-based list-price factors after discount and rounding:
| Category | Observed factor |
|---|---|
| Bikes | 72% |
| Components | 74% |
| Clothing | 65% |
| Accessories | 60% |
The source does not document the historical pricing policy, so the notebook keeps both measures visible and describes the explanation as evidence-based rather than fact. That is safer than silently overwriting one number with the other.
5. When a long-running task needs steering
Osmos spent longer than expected in discovery and promotion-semantics research. That did not automatically mean capacity throttling: there were no 429 responses, quota failures, or increasing retry intervals.
The practical response was:
- Look at progress messages, not only the numeric status code.
- Identify whether the task is still making useful progress or repeating discovery.
- Refresh authentication if the follow-up token has expired.
- Send a focused follow-up to the same task: stop further research, use the validated staging-create/native-rename path, write the Gold tables, publish the notebook, and validate.
- Never create a replacement task just because the first task is slow.
- Verify persisted tables, notebook publication, row counts, and validation output after completion.
The important control pattern is not “cancel and start over.” It is “preserve task identity, tighten the instruction, and verify the result.”
What this gives downstream users
The output is ready for downstream analytics and agent experiences:
- dimensions provide stable business entities;
- line and order facts preserve grain;
- the date dimension supports time analysis;
- the bridge preserves customer-address relationships;
- validation evidence makes the model explainable;
- the reconciliation finding prevents a misleading single KPI.
Project Osmos did not remove the need for judgement. It made the engineering work inspectable, repeatable, and easier to steer.
Loading comments…